The Fast Fourier Transform (FFT) applied to FTIR Data
This tutorial explains how time-domain interferogram data from an Fourier Transform Infrared (FTIR) spectrometer is converted into a frequency-domain spectrum. The starting point is the interferogram itself, which is the raw data collected by an FTIR spectrometer.
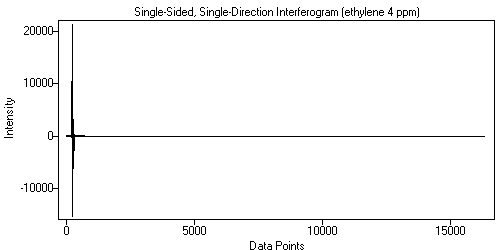
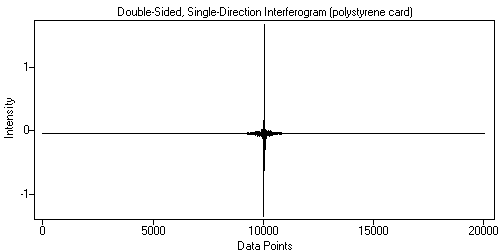
An interferogram has a 'center-burst', also called the 'zero-path-difference' point, or 'ZPD'. This corresponds to the place where maximum interference is produced by the moving mirror in the instrument. This center-burst can be placed in the middle or near to the beginning of the interferogram. The placement of the center-burst is determined by when the instrument starts data collection during the mirror travel. When the center-burst is in the middle, the interferogram is called 'double-sided' or 'symmetric'. When it is placed at the beginning of the interferogram, it is called 'single-sided' or 'asymmetric'.
Here are examples:
|
|
| Figure 1. Single-Sided, Single-Direction Interferogram. | Figure 2. Double-Sided, Single-Direction Interferogram. |
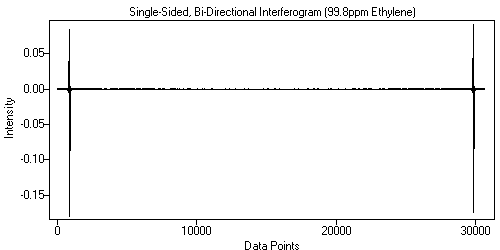
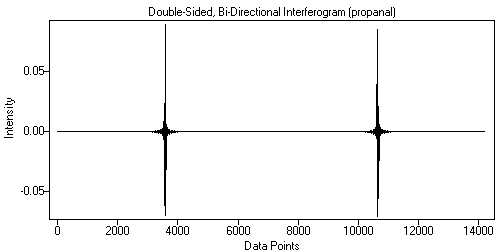
Also, the interferogram may be 'doubled', or 'bi-directional', which simply means that data is collected in both mirror directions. These two interferograms are typically combined into a single array, with the forward-direction interferogram in the first half and the backward-direction interferogram in the second half. The backward-direction interferogram is of course reversed.
|
|
| Figure 3. Single-Sided, Bi-Directional Interferogram. | Figure 4. Double-Sided, Bi-Directional Interferogram. |
In the case of bi-directional data, the foward and backward data are transformed separately and then recombined by averaging. This is necessary because the the two interferograms are not in phase, and must be phase-corrected independently.
This tutorial will show the steps in performing the FFT on an interferogram. The single-sided, single-direction interferogram from Figure 1 will be used because it is a bit more complicated than the double-sided case. This tutorial is patterned after the excellent Pictorial Essay starting on page 108 in Reference 2. All the data processing and graphics production were done in Essential FTIR.
-
Normalize the Interferogram
The mean of the data is subtracted from the data, which brings the baseline of the data to 0. This is needed because later the data is zero-filled, and not doing this would introduce a discontinuity into the data. A discontinuity, or spike, would result in a sine wave moving through the FFT'd data.
-
Zero-Fill the Interferogram
The FFT requires that the number of points in the interferogram be a power of 2. If it is not, then the size of the array is increased to the next higher power of two and the added points are set to 0. The array size can then be increased by the zero-fill factor (2, 4, 8, or 16 in Essential FTIR). For example, if the interferogram contains 16,000 points, the array will be padded with zeros to make it 16,384 points. If the zero-fill factor is 4 the array will be padded with zeros out to 65,536 points. Zero-filling the interferogram before the FFT results in interpolated points that lie between the 'actual' points that would result from non-zero-filled data, making the resulting data look smoother. This technique also improves the photometric accuracy of the data, because a computed data point will rarely correspond to the maximum absorbtion of a given spectral feature. Although zero-filling increases the number of data points in the spectrum, it cannot increase the optical resolution of the spectrum. -
Prepare Phase-Correction Data
The interferogram contains out-of-phase elements which are introduced by optical path differences in the instrument. The data must be phase corrected or the resulting spectrum will not be photometrically accurate. The phase correction method used here is the Mertz method (Reference 1).- An array of the same size as the zero-filled interferogram is prepared and filled with zeros.
-
The 256 points centered around ZPD are copied from the interferogram into the new array, but are scaled by a ramp function that is 1 at the ZPD and 0 at the beginning and end.
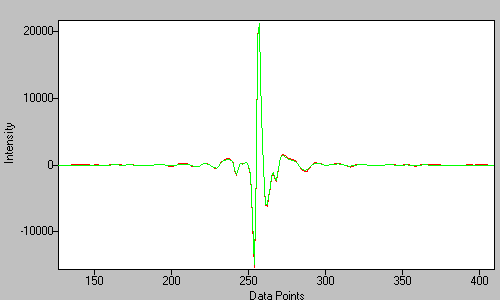
Figure 5. The interferogram (red) and prepared phase-correction data (green) -
The interferogram data is rotated so that the right side of the data after the ZPD, including the ZPD point, is moved to the front of the array. The data to the left of the ZPD is reversed and placed at the end of the array.
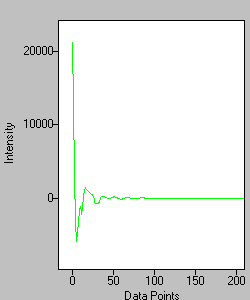
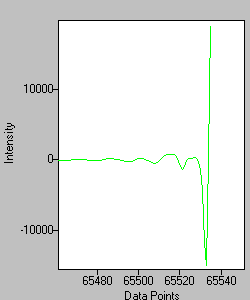
Figure 6. The Left and Right sides of the rotated array. -
The data is FFT'd, producing real and imaginary data arrays.
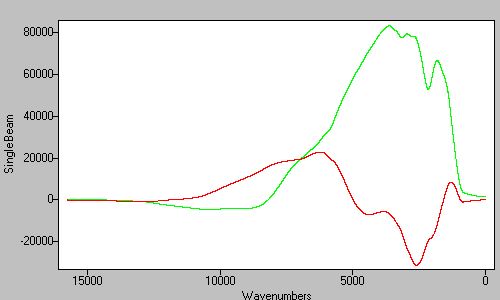
Figure 7. The real (green) and imaginary (red) mertz data after the FFT. -
The power spectrum is derived from the real and imaginary data from the previous step. The power spectrum is the square root of the sum of the squares of the real and imaginary data.
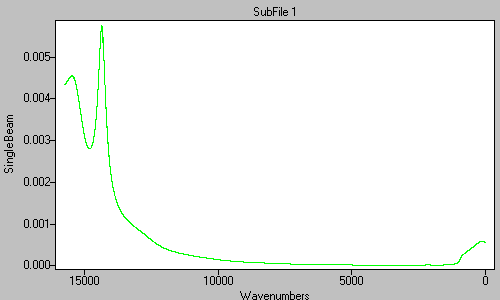
Figure 8. The power spectrum derived from the real and imaginary data in Figure . -
The real and imaginary data arrays are multiplied by the power spectrum (Figure 8). This is the end of the preparation of the phase correction data.
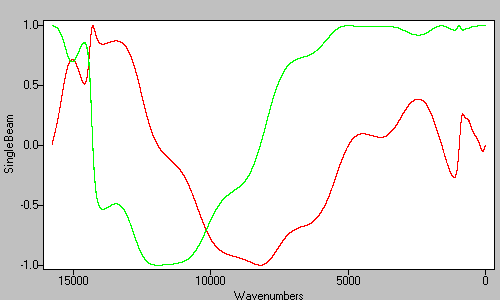
Figure 9. The final real (green) and imaginary (red) mertz phase correction data.
-
The sample data is FFT'd and phase corrected
-
The original interferogram is apodized using a triangular function, with the value of 0 at the left side, a value of 1 at 2 times the ZPD location, and ramping back down to 0 at the right side.
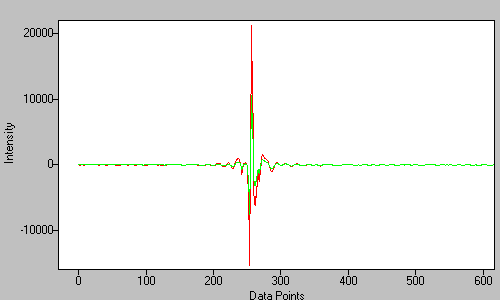
Figure 10. The original interferogram (red) and the apodized interferogram (green). -
The apodized interferogram is zero-filled.
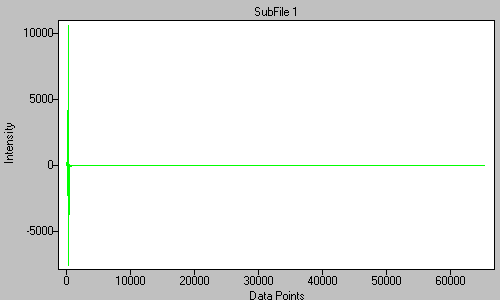
Figure 11. The apodized data from Figure 10 has been zero-filled to 65,536 points. -
The interferogram is rotated .
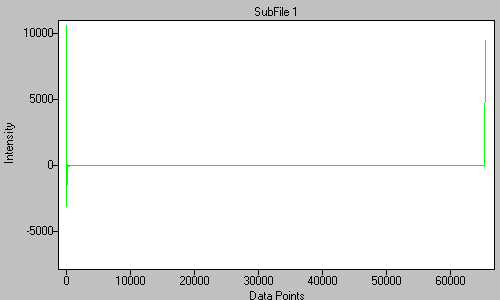
Figure 12. The rotated inteferogram. -
The interferogram is FFT'd.
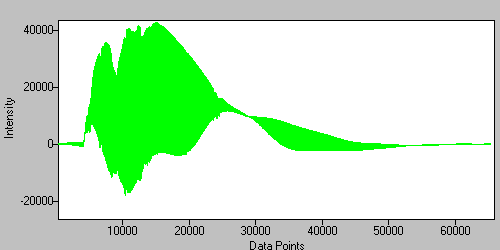
Figure 13. The real data are the odd-numbered points and the imaginary data are the even-numbered points. 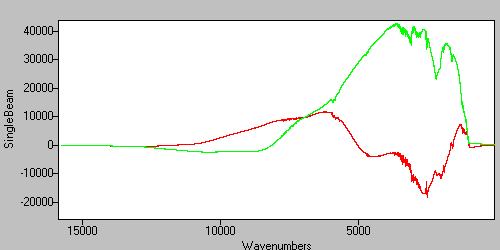
Figure 14. The data from Figure 13, separated into real (green) and imaginary (red) arrays. -
The complex (real and imaginary) data are multiplied by the complex phase correction data from step 3. The result is the singlebeam spectrum for the interferogram. The data in the figure have been truncated to the Mid-Infrared region of 4000 to 400 wavenumbers.
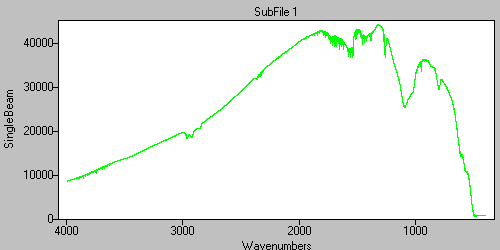
Figure 15. The final single-beam data.
-
The original interferogram is apodized using a triangular function, with the value of 0 at the left side, a value of 1 at 2 times the ZPD location, and ramping back down to 0 at the right side.
-
Ratio and conversion to Absorbance
-
The data in Figure 15 were obtained with the sample. Infrared Spectroscopy is a single-beam technique, and the sample data must be ratiod against a background spectrum to produce a transmittance spectrum. In this case, the background spectrum was collected using a gas cell filled with Nitrogen. The ratio step produces the so-called transmittance spectrum.
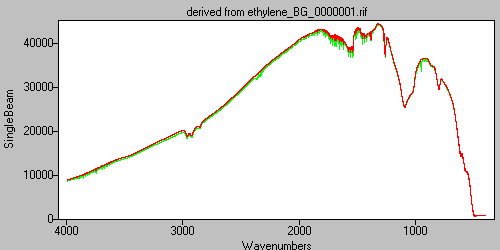
Figure 16. The sample (green) and background (red) single-beam spectra. -
The sample and background single-beam spectra are ratiod against each other to produce the Transmittance spectrum. The result is a typically noisy real-world vapor-phase spectrum showing the presense of CO2 and H20 as well as the ethylene sample.
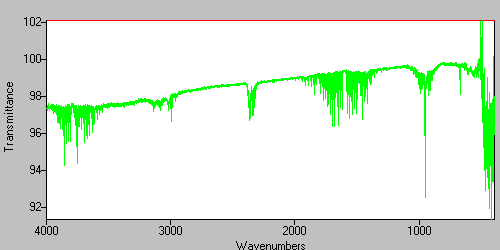
Figure 17. The transmittance spectrum.
-
The data in Figure 15 were obtained with the sample. Infrared Spectroscopy is a single-beam technique, and the sample data must be ratiod against a background spectrum to produce a transmittance spectrum. In this case, the background spectrum was collected using a gas cell filled with Nitrogen. The ratio step produces the so-called transmittance spectrum.
-
The Transmittance data is converted to Absorbance.
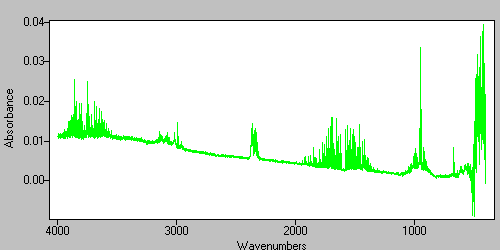
Figure 18. The absorbance spectrum.
References
- Lawrence Mertz, Transfomations in Optics, John Wiley and Sons, Inc., New York, 1965
- Griffiths, Peter R. and de Haseth, James A., Fourier Transform Infrared Spectrometry, John Wiley and Sons, Inc., New York, 1986